
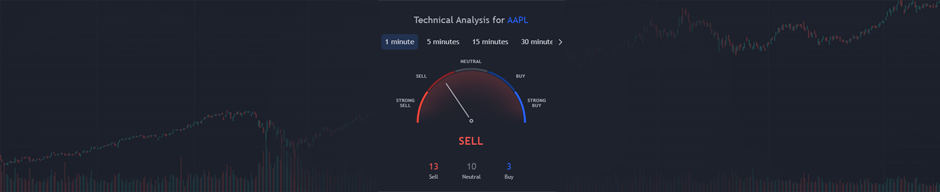
Technical Analysis Widget
The Technical Analysis Widget is an advanced tool that displays ratings based on technical indicators. Our beautifully designed gauge lets you see the summary based on all indicators at a quick glance. You no longer have to apply multiple indicators to analyze a financial instrument since our widget does that for you. On top of that, all ratings are shown in real time.
Market Overview Widget
Market Overview Widget provides a quick glance at the latest market activity across various sectors. It works great for homepages, and it can be configured to take users to a page with a larger chart on your site. Set your own instrument lists and tabs to cover what you need, adjust the timeframe for the chart or even hide the chart completely.
Market Data Widget
Market Data Widget includes a detailed overview of global markets performance, including change value (both in absolute and percentage numbers), Open, High, Low and Close values for the selected financial instruments.
Stock Market Widget
Stock Market Widget shows top 5 gaining, losing and active stocks for the day. Stock Market is updated based on current market activity, so they always show the most relevant stocks.
Economic Calendar Widget
Economic Calendar Widget shows key upcoming economic events, announcements and news. You can set up relevant economic calendar filters in a few clicks, selecting event importance and affected currencies.
Ticker Widget
Ticker Widget is a horizontal quick-glance bar with instrument prices. You can display up to 15 different symbols with their latest price and daily change.
Ticker Tape Widget
Our classic Ticker Tape Widget is intended to make it simple to add the look and feel of Wall Street to websites. Start displaying stock exchange-style running ticker symbols in just a few clicks!
Single Ticker Widget
Single Ticker Widget displays the price and change percentage of your preferred symbol. This little yet powerful widget is great for seeing the latest price update.
Mini Chart Widget
Mini Chart Widget displays the price, change percentage along with a basic chart of your selected symbol. Pick your symbol and customize the date range in just a few clicks.
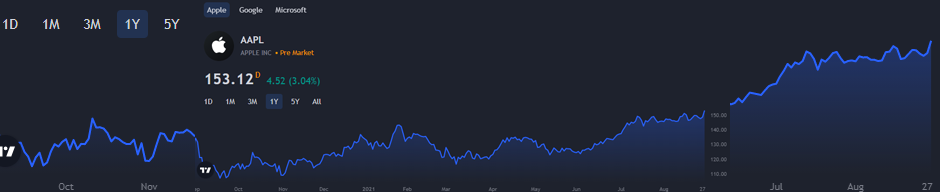
Symbol Overview Widget
Symbol Overview Widget shows latest quotes, a simple chart and key fundamental fields for a single stock. It’s in-depth, yet detailed, and it’s a great solution for web and mobile. You can add multiple tabs to cover several stocks and use a “Chart Only” mode for a simpler look.
Symbol Info Widget
Key symbol info in an easily readable format. Company financials and quotes are available at a quick glance.
Forex Cross Rates Widget
Forex Cross Rates Widget allows you to display real-time quotes of the selected currencies in comparison to the other major currencies at a glance. Select relevant currencies and generate your rates table in just a few clicks.
Forex Heat Map Widget
Forex Heat Map Widget gives a quick overview of action in the currency markets. It lets you spot strong and weak currencies in real-time & how strong they are in relation to one another. This trading tool can help choose trading strategies, find opportunities and trade with confidence. Create a personal rates table with just a few clicks by selecting the currencies you want. Give this free tool to your users by copying the Embed code once finished with customization.